Crypto Exchange Profitability & Break-Even Analysis
Every crypto exchange founder asks the same question: when will this thing actually make money?
The revenue model matters, but it is only half the equation. The other half is understanding your cost structure, unit economics, and the specific volume thresholds where revenue overtakes expenses. That is what this article covers — with real numbers, not hand-waving.
Whether you are planning to start a crypto exchange with $15K or $200K, you will find projections mapped to your budget tier below. We will walk through fixed costs, variable costs, revenue math, break-even scenarios, and 12-month P&L projections so you can model your own path to profitability.
Table of Contents
- Unit Economics of a Crypto Exchange
- Fixed Costs Breakdown
- Variable Costs That Scale With Volume
- Revenue Streams With Realistic Numbers
- Break-Even Scenarios: Three Tiers
- Monthly Volume Targets by Tier
- User Acquisition Cost Benchmarks
- Lifetime Value Calculations
- 12-Month P&L Projection: Lean Startup
- 24-Month P&L Projection: Mid-Market
- Key Metrics to Track
- Frequently Asked Questions
Unit Economics of a Crypto Exchange
Before building financial projections, you need to understand two fundamental numbers: revenue per user and cost per user. The gap between them determines whether your exchange has a viable business model or a cash-burning hobby.
Revenue Per User (ARPU)
Average revenue per user depends on trader segment:
| Trader Segment | Monthly Volume | Avg Take Rate | Monthly ARPU |
|---|---|---|---|
| Casual retail | $1K-$5K | 0.18% | $1.80-$9.00 |
| Active retail | $10K-$50K | 0.15% | $15-$75 |
| Power trader | $50K-$200K | 0.12% | $60-$240 |
| Institutional | $500K-$5M+ | 0.05-0.08% | $250-$4,000 |
Most new exchanges start with predominantly casual and active retail users. A blended ARPU of $20-$40/month is a realistic starting assumption. As you add features like margin trading, staking, and listing fees, ARPU climbs.
Cost Per User
Cost per user includes both acquisition and servicing:
- Acquisition cost (CAC): $5-$50 depending on channel and geography
- Monthly servicing cost: $1-$5 per active user (support, KYC processing, infrastructure load)
- Payment processing per deposit: 1-3% for fiat on-ramps
The unit economics work when ARPU consistently exceeds marginal cost per user. For an exchange with $30 blended ARPU and $8 marginal cost per user, that is $22/month in gross contribution per active trader.
Fixed Costs Breakdown
Fixed costs are what you pay regardless of whether you have 10 users or 10,000. These define your break-even floor.
Technology: $3K-$100K
This is where choosing your approach matters most:
| Approach | Upfront Cost | Monthly Ongoing |
|---|---|---|
| White-label software (e.g., Codono) | $3K-$15K | $0-$500 |
| Custom development (MVP) | $50K-$150K | $5K-$15K |
| Custom development (full) | $200K-$500K+ | $15K-$40K |
White-label crypto exchange software collapses the technology line item from a six-figure expense to a manageable startup cost. This is why most successful new exchanges start with a proven platform and customize later.
Licensing & Compliance: $10K-$200K
Regulatory costs vary dramatically by jurisdiction:
| Jurisdiction | License Cost | Timeline | Annual Renewal |
|---|---|---|---|
| Estonia (VASP) | $10K-$25K | 3-6 months | $5K-$10K |
| Lithuania | $8K-$20K | 2-4 months | $3K-$8K |
| Dubai (VARA) | $50K-$150K | 6-12 months | $20K-$50K |
| US (state MTLs) | $100K-$500K+ | 12-24 months | $50K-$200K |
| Offshore (Seychelles, SVG) | $5K-$15K | 1-3 months | $2K-$5K |
Many founders start in lighter-touch jurisdictions and expand as revenue justifies higher compliance costs.
Team: $5K-$50K/Month
Team costs scale with ambition:
| Team Size | Roles | Monthly Cost |
|---|---|---|
| Solo founder | Everything | $0-$5K (opportunity cost) |
| 2-3 people | Founder + support + marketing | $5K-$15K |
| 5-8 people | + developers + compliance | $20K-$40K |
| 10+ people | Full departments | $40K-$100K+ |
Starting lean is not just acceptable — it is strategically smart. Many profitable exchanges today launched with one or two people handling everything, then hired as revenue grew.
Infrastructure: $500-$5K/Month
Server and infrastructure costs for a crypto exchange:
- Cloud hosting (AWS/GCP/dedicated): $300-$3K/month
- DDoS protection & CDN: $50-$500/month
- Monitoring & logging: $50-$200/month
- Email & communication tools: $50-$200/month
- Domain, SSL, misc: $20-$50/month
Start with $500-$800/month and scale as traffic demands. Cloud providers let you increase capacity without over-provisioning upfront.
Variable Costs That Scale With Volume
Unlike fixed costs, variable costs grow proportionally with trading activity. Understanding these is critical for accurate margin calculations.
Payment Processing: 1-3% of Fiat Volume
Fiat on-ramps through payment processors take a cut:
- Bank wire transfers: $5-$25 flat per transaction
- Credit/debit card deposits: 2.5-3.5% per transaction
- Third-party processors (MoonPay, Transak): 1-2% (but they handle compliance)
Many exchanges pass these costs to users through deposit fees, effectively making payment processing margin-neutral.
Blockchain Gas Fees
On-chain transaction costs hit your bottom line directly for withdrawals:
- Bitcoin: $0.50-$5.00 per transaction (varies with network congestion)
- Ethereum: $1-$30+ per transaction (highly variable)
- Layer 2s and alt chains (Solana, Tron, BSC): $0.01-$0.50
Smart exchanges batch withdrawals and charge flat withdrawal fees that cover gas plus a small margin. A $5 flat BTC withdrawal fee when actual gas is $1.50 generates $3.50 in net revenue per withdrawal.
Customer Support: $2-$10 Per Ticket
Support costs per ticket depend on staffing model:
- Self-serve (FAQ, knowledge base): ~$0.10 per resolution
- Chatbot + human escalation: $1-$3 per ticket
- Dedicated human support: $5-$10 per ticket
Budget 0.5-1.5 support tickets per active user per month. Automating common queries (deposit status, KYC progress, fee explanations) dramatically reduces this cost.
KYC/AML Verification: $1-$5 Per User
Third-party KYC providers charge per verification:
- Basic identity check: $1-$2
- Enhanced due diligence: $3-$10
- Ongoing transaction monitoring: $0.01-$0.05 per transaction
This is a one-time cost per user but can spike during promotional periods when sign-ups surge.
Revenue Streams With Realistic Numbers
Understanding where revenue actually comes from — and how much — is essential for realistic projections. We covered the strategic side in our revenue models overview. Here we focus on the numbers.
Trading Fees: 60-80% of Revenue
Trading fees are the backbone of exchange revenue. Realistic averages:
- Maker fee: 0.05-0.10%
- Taker fee: 0.10-0.20%
- Blended average (weighted by volume): 0.10-0.18%
On $10M monthly volume at 0.15% blended rate, trading fees generate $15,000/month. At $50M volume, that is $75,000/month.
Withdrawal Fees: 10-15% of Revenue
Flat withdrawal fees generate steady income:
- Crypto withdrawal: $1-$10 flat per transaction (varies by asset)
- Fiat withdrawal: $5-$25 per transaction
If 30% of your active users make 2 withdrawals per month at an average $4 net margin per withdrawal, 500 active users generate $1,200/month from withdrawals alone.
Listing Fees: 5-15% of Revenue
Token listing fees are high-margin revenue:
- Small cap / new projects: $1K-$10K per listing
- Mid-cap tokens: $10K-$50K per listing
- Major tokens seeking additional venues: $50K-$200K+ per listing
Even listing 2-3 small projects per month at $3K each adds $6K-$9K in nearly pure-margin revenue.
Staking & Earn Commissions: 5-10% of Revenue
Offering staking or savings products and taking a commission on yields:
- Commission on staking rewards: 5-15% of user earnings
- Spread on savings products: 1-3% annual spread
With $2M in staked assets earning 6% average yield and a 10% commission, monthly revenue is $1,000. This scales well with AUM.
Margin Trading Interest: Variable
If you offer margin or futures trading, interest charges on borrowed funds become significant:
- Daily interest rate: 0.02-0.05%
- Annualized: 7-18%
This revenue stream requires more capital and risk management but generates strong returns for exchanges at scale.
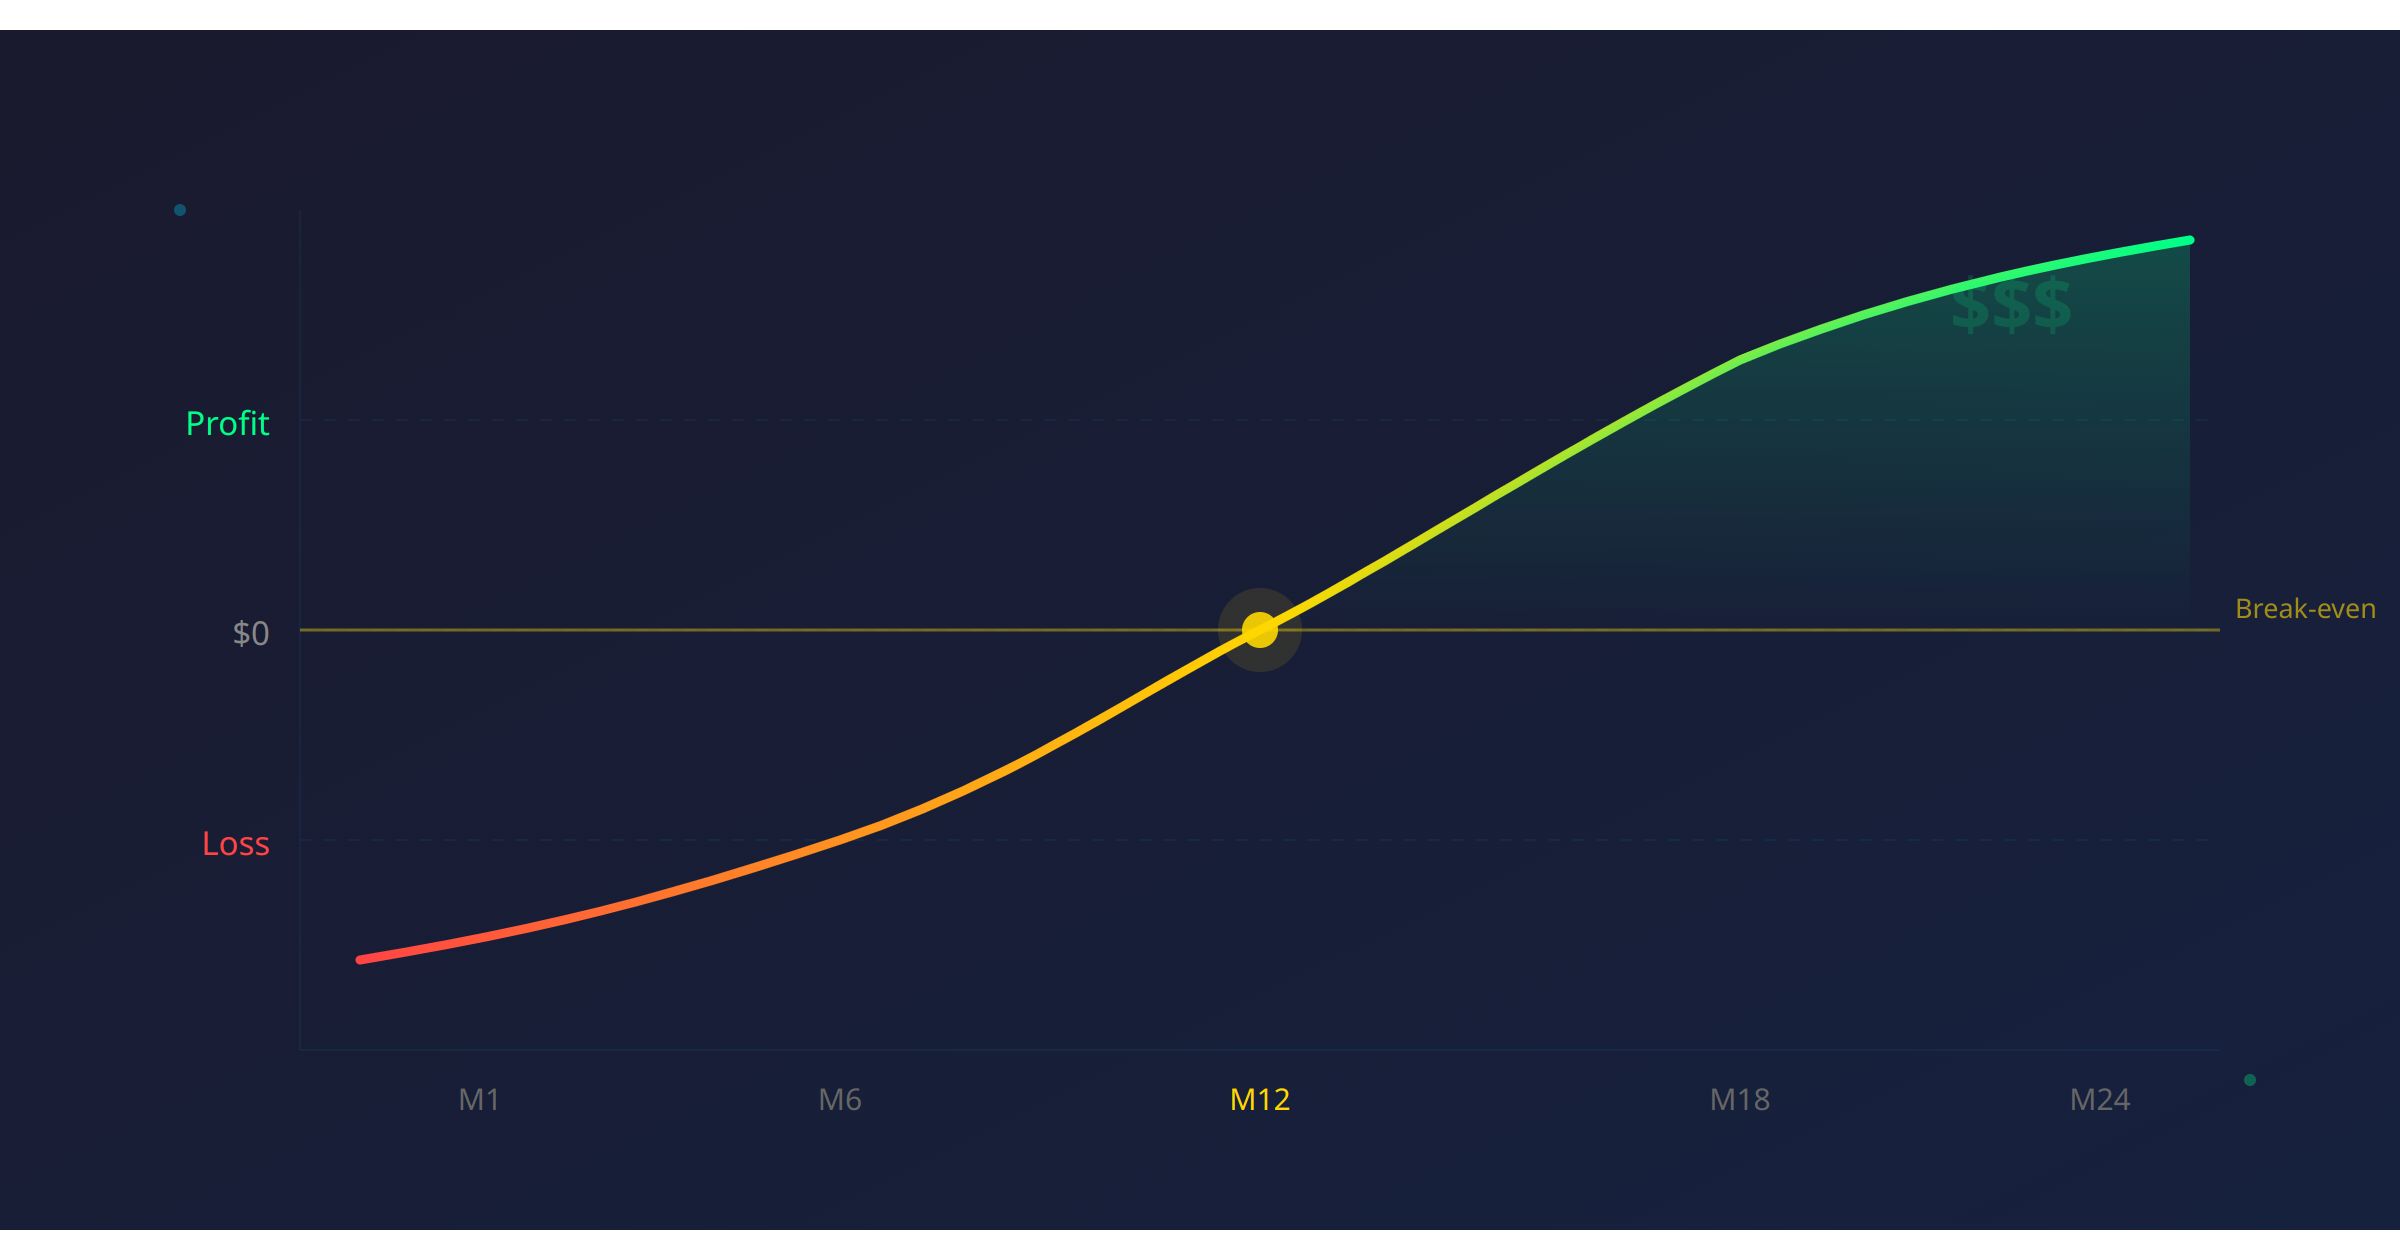
Break-Even Scenarios: Three Tiers
Now the core analysis. We model three launch tiers with different capital requirements, cost structures, and break-even timelines.
Tier 1: Lean Startup ($15K-$25K Launch)
Profile: Solo founder or small team using white-label software, offshore or light-touch jurisdiction, minimal marketing budget.
| Cost Category | One-Time | Monthly |
|---|---|---|
| White-label software license | $5K-$10K | $0-$300 |
| Company formation + basic license | $5K-$10K | $200-$500 |
| Infrastructure | — | $500-$800 |
| Marketing | — | $500-$1,500 |
| Support (founder handles) | — | $0 |
| Misc (legal, accounting) | — | $300-$500 |
| Total | $10K-$20K | $1,500-$3,600 |
Break-even monthly revenue target: $2K-$4K
At 0.15% take rate, this requires $1.3M-$2.7M monthly trading volume. With 50-100 active traders averaging $20K-$30K monthly volume each, this is achievable within 4-8 months of focused user acquisition.
Tier 2: Mid-Market ($50K-$80K Launch)
Profile: Small team (3-5 people), reputable jurisdiction license, moderate marketing budget, professional support.
| Cost Category | One-Time | Monthly |
|---|---|---|
| Software + customization | $10K-$20K | $500-$1,000 |
| License (EU VASP or similar) | $15K-$30K | $500-$1,000 |
| Team (3-5 people) | — | $10K-$20K |
| Infrastructure | — | $1K-$2K |
| Marketing | — | $3K-$8K |
| Support (1 dedicated person) | — | $2K-$4K |
| Legal & compliance | $5K-$10K | $1K-$2K |
| Total | $30K-$60K | $18K-$38K |
Break-even monthly revenue target: $20K-$40K
At 0.15% take rate, you need $13M-$27M monthly trading volume. With 300-700 active traders, this is reachable in 8-14 months.
Tier 3: Enterprise ($200K+ Launch)
Profile: Full team, top-tier jurisdiction (Dubai, Singapore, or US), custom development or heavy customization, institutional-grade infrastructure.
| Cost Category | One-Time | Monthly |
|---|---|---|
| Custom development + software | $80K-$200K | $10K-$25K |
| Premium license | $50K-$150K | $5K-$15K |
| Team (10-20 people) | — | $50K-$120K |
| Infrastructure | — | $3K-$10K |
| Marketing | — | $15K-$50K |
| Support team | — | $8K-$20K |
| Legal, compliance, audits | $20K-$50K | $5K-$15K |
| Total | $150K-$400K | $96K-$255K |
Break-even monthly revenue target: $100K-$260K
You need $67M-$173M monthly trading volume or significant alternative revenue (listing fees, institutional services). Timeline: 18-36 months. But the revenue ceiling is substantially higher.
Monthly Volume Targets by Tier
Summarized volume targets at different take rates:
| Monthly Costs | 0.10% Take Rate | 0.15% Take Rate | 0.20% Take Rate |
|---|---|---|---|
| $3K (lean) | $3M | $2M | $1.5M |
| $8K (lean+) | $8M | $5.3M | $4M |
| $25K (mid) | $25M | $16.7M | $12.5M |
| $50K (mid+) | $50M | $33.3M | $25M |
| $150K (enterprise) | $150M | $100M | $75M |
These figures represent trading fee revenue only. Adding withdrawal fees, listing fees, and other streams can reduce required volume by 20-40%.
User Acquisition Cost Benchmarks
Understanding customer acquisition cost (CAC) is critical for modeling growth spend. Current 2025-2026 benchmarks:
| Channel | CAC Range | Quality |
|---|---|---|
| Organic SEO / content | $2-$8 | High (intent-driven) |
| Crypto Twitter / X | $5-$15 | Medium-High |
| Referral programs | $10-$25 | High (warm leads) |
| Telegram / Discord communities | $3-$12 | Medium |
| Google Ads (crypto keywords) | $30-$80 | Medium (restricted) |
| Influencer marketing | $15-$50 | Variable |
| Airdrops / token incentives | $1-$5 | Low (mercenary users) |
For most new exchanges, a blended CAC of $15-$30 is realistic when combining organic, referral, and community channels. Read our full user acquisition guide for detailed strategies.
The critical lesson: not all users are equal. A $50 user who trades $100K/month is vastly more valuable than a $2 airdrop user who never deposits.
Lifetime Value Calculations
Lifetime value (LTV) depends on three variables: ARPU, gross margin, and retention rate.
LTV Formula: LTV = ARPU x Gross Margin x Average Lifespan (months)
Example Calculations
Casual trader:
- ARPU: $8/month
- Gross margin: 70%
- Average lifespan: 6 months
- LTV = $8 x 0.70 x 6 = $33.60
Active trader:
- ARPU: $45/month
- Gross margin: 75%
- Average lifespan: 14 months
- LTV = $45 x 0.75 x 14 = $472.50
Power trader:
- ARPU: $150/month
- Gross margin: 80%
- Average lifespan: 24 months
- LTV = $150 x 0.80 x 24 = $2,880
CAC/LTV Ratio Targets
| Ratio | Interpretation |
|---|---|
| <1:1 | Losing money on every user — unsustainable |
| 1:1 to 1:2 | Marginal — need to improve retention or reduce CAC |
| 1:3 | Healthy — industry standard target |
| 1:5+ | Excellent — can afford to scale aggressively |
With a blended CAC of $20 and blended LTV of $120, your ratio is 1:6 — strong enough to invest heavily in growth.
12-Month P&L Projection: Lean Startup
Here is a month-by-month projection for a Tier 1 lean exchange using Codono exchange software with a $15K initial investment.
Assumptions: 15% month-over-month user growth, $25 blended ARPU, $500 base marketing spend increasing with revenue, 0.15% take rate.
| Month | Active Users | Trading Volume | Revenue | Costs | Net P&L | Cumulative |
|---|---|---|---|---|---|---|
| 1 | 20 | $400K | $600 | $2,800 | -$2,200 | -$17,200 |
| 2 | 35 | $700K | $1,050 | $3,000 | -$1,950 | -$19,150 |
| 3 | 50 | $1.0M | $1,500 | $3,200 | -$1,700 | -$20,850 |
| 4 | 65 | $1.3M | $2,100 | $3,300 | -$1,200 | -$22,050 |
| 5 | 80 | $1.8M | $2,900 | $3,500 | -$600 | -$22,650 |
| 6 | 100 | $2.5M | $3,750 | $3,800 | -$50 | -$22,700 |
| 7 | 120 | $3.2M | $4,800 | $4,000 | $800 | -$21,900 |
| 8 | 145 | $4.0M | $6,200 | $4,300 | $1,900 | -$20,000 |
| 9 | 170 | $5.0M | $7,800 | $4,600 | $3,200 | -$16,800 |
| 10 | 200 | $6.2M | $9,500 | $5,000 | $4,500 | -$12,300 |
| 11 | 235 | $7.5M | $11,500 | $5,500 | $6,000 | -$6,300 |
| 12 | 275 | $9.0M | $13,800 | $6,000 | $7,800 | $1,500 |
Result: Break-even on invested capital by month 12. Monthly profit of $7,800 with 275 active users. Annualized run-rate of ~$94K revenue entering year two.
This is conservative. Exchanges that capture a niche market or benefit from a bull cycle often hit these numbers faster.
24-Month P&L Projection: Mid-Market
A Tier 2 exchange with $60K initial investment and a team of four.
Assumptions: 20% month-over-month user growth (higher due to marketing budget), $35 blended ARPU, $5K/month listing fee revenue starting month 6.
| Quarter | Avg Active Users | Quarterly Volume | Quarterly Revenue | Quarterly Costs | Net P&L | Cumulative |
|---|---|---|---|---|---|---|
| Q1 | 80 | $6M | $9K | $72K | -$63K | -$123K |
| Q2 | 180 | $16M | $28K | $78K | -$50K | -$173K |
| Q3 | 380 | $38M | $72K | $85K | -$13K | -$186K |
| Q4 | 700 | $80M | $145K | $95K | $50K | -$136K |
| Q5 | 1,100 | $140M | $245K | $110K | $135K | -$1K |
| Q6 | 1,600 | $220M | $375K | $130K | $245K | $244K |
| Q7 | 2,200 | $310M | $510K | $155K | $355K | $599K |
| Q8 | 3,000 | $430M | $700K | $185K | $515K | $1.1M |
Result: Break-even on total invested capital by month 15 (Q5). By month 24, cumulative profit exceeds $1M. The exchange generates $170K+/month in net profit with 3,000 active users.
The mid-market tier benefits from compounding: more users generate more liquidity, which attracts more users, which increases volume per user.
Key Metrics to Track
Profitable exchanges obsess over a specific set of metrics. Track these weekly at minimum:
Growth Metrics
- Daily Active Users (DAU): The single most important leading indicator. Growing DAU predicts growing revenue. Target: 20-30% of registered users.
- DAU/MAU Ratio: Measures engagement stickiness. Above 0.3 is good, above 0.5 is excellent.
- New User Registration Rate: Track weekly sign-ups and conversion to first trade.
Revenue Metrics
- Volume Per User: Average monthly trading volume per active user. Target: $15K-$50K for retail exchanges.
- Take Rate: Actual blended fee percentage after discounts and maker rebates. Track weekly for drift.
- ARPU: Monthly revenue divided by active users. Should trend upward as you add revenue streams.
- Revenue Per Employee: Total revenue divided by team size. Target: >$15K/month per team member.
Efficiency Metrics
- CAC (Customer Acquisition Cost): Total marketing spend divided by new depositing users. Break down by channel.
- CAC/LTV Ratio: Must stay above 1:3 for sustainable growth. Recalculate quarterly as retention data matures.
- CAC Payback Period: Months to recover acquisition cost from a user’s contribution. Target: <3 months.
- Gross Margin: Revenue minus variable costs (gas fees, payment processing, support). Target: 65-80%.
Operational Metrics
- Uptime: Target 99.9%+. Downtime directly kills revenue and trust.
- Support Ticket Volume: Tickets per 100 active users. Lower is better. Target: <15/month.
- Withdrawal Processing Time: Impacts user satisfaction and retention.
The Dashboard That Matters
At a minimum, build a weekly dashboard showing:
- Active users (DAU/WAU/MAU)
- Trading volume (daily + 7-day rolling average)
- Gross revenue and net revenue
- Blended take rate
- CAC by channel
- Cash runway remaining
If any metric trends negative for three consecutive weeks, investigate immediately.
The Path Forward
Crypto exchange profitability is not a mystery — it is math. The numbers in this article give you a framework, but your specific break-even timeline depends on three controllable factors: launch costs, monthly burn rate, and how quickly you acquire and retain active traders.
The fastest path to profitability starts with minimizing fixed costs. Using proven crypto exchange software instead of building from scratch saves $50K-$200K upfront and months of development time. Check our pricing to see how Codono fits into your financial model.
From there, focus relentlessly on the metrics that matter: active users, volume per user, and take rate. Get those right, and the break-even math takes care of itself.
Ready to build your own projections? Start with Codono and put your capital toward growth instead of code.
Frequently Asked Questions
Codono Team
Codono builds enterprise-grade crypto exchange software deployed by 250+ operators across 40+ countries. Our team writes from production experience running spot, derivatives, custody, and compliance at scale.
View all posts by Codono Team →