How to Design a Crypto Exchange Fee Structure That Maximizes Revenue
Table of Contents
- Your Fee Structure Is Your Most Important Business Decision
- Fee Structure Types: Choosing Your Model
- How Major Exchanges Structure Their Fees
- Maker-Taker Spread Economics
- Volume-Based Tier Design
- Withdrawal Fee Strategies
- Deposit Fees and Fiat On-Ramp Margins
- Listing Fees as a Revenue Stream
- Token-Based Fee Discounts: The BNB Model
- Futures and Margin Fee Considerations
- The Psychology of Exchange Fees
- Implementation Considerations
- Competitive Pricing Strategy for New Exchanges
- Fee Revenue Modeling With Real Numbers
- Putting It All Together
Your Fee Structure Is Your Most Important Business Decision
Every crypto exchange operator eventually faces the same question: how do I price my fees? Set them too high and traders migrate to cheaper competitors overnight. Set them too low and your exchange burns cash faster than it can acquire users. The difference between a profitable exchange and a failing one often comes down to basis points.
The crypto exchange fee structure is not just a pricing decision — it is a product decision, a marketing decision, and a competitive positioning decision all rolled into one. Your fees communicate who you are. Coinbase charges premium fees because it targets retail users who value simplicity. Binance undercuts everyone because it targets volume-driven traders. Each approach works, but only when the rest of the business aligns with it.
If you are building or operating a crypto exchange, this guide walks through every dimension of fee design with real numbers, competitive benchmarks, and implementation considerations. We will cover the models that work, the ones that do not, and how to think about fee strategy as your exchange grows.
Fee Structure Types: Choosing Your Model
There are four fundamental approaches to exchange trading fees. Most successful exchanges use a hybrid, but understanding each model in isolation helps you decide which elements to combine.
Flat Fee Model
The simplest approach: charge every trade the same percentage regardless of order type or volume. A flat 0.15% fee on all trades is easy to communicate, easy to implement, and easy for users to understand.
Advantages: Zero complexity, transparent pricing, simple accounting.
Disadvantages: No incentive for market makers, no reward for loyalty, vulnerable to competitors offering tiered discounts.
Flat fee models work for very early-stage exchanges that lack the volume to justify tiers, or for niche platforms where simplicity is the core value proposition. Most exchanges outgrow this model within the first year.
Maker-Taker Model
The industry standard. Makers (limit orders that add liquidity) pay lower fees than takers (market orders that remove liquidity). The logic is straightforward: liquidity is the most valuable thing on an exchange, so you subsidize the people who create it.
Typical maker-taker spreads range from 2 to 10 basis points. A common structure might be 0.10% maker / 0.20% taker, giving makers a 50% discount for providing liquidity.
Tiered Volume-Based Model
Layer volume tiers on top of maker-taker pricing and you get the model used by nearly every major exchange. Traders who generate more volume earn lower fees, creating a flywheel: lower fees attract more volume, more volume justifies lower fees, and high-volume traders become sticky because switching exchanges means resetting their tier.
Zero-Fee Model
Some exchanges have experimented with zero trading fees, monetizing through other channels — wider spreads on quoted prices, withdrawal fees, premium features, or token economics. Robinhood popularized this in traditional equities with payment for order flow. In crypto, exchanges like Phemex and MEXC have offered zero-fee spot trading on selected pairs.
Zero-fee models are attention-grabbing but difficult to sustain. Without trading fee revenue, your exchange must find $500K+ per month from other sources just to cover operational costs. As explored in our revenue models guide, diversification matters — but trading fees remain the foundation for most operators.
How Major Exchanges Structure Their Fees
Understanding the competitive landscape gives you benchmarks to price against. Here is how the largest exchanges structure their fees as of early 2026:
| Exchange | Base Maker | Base Taker | Top Tier Maker | Top Tier Taker | Tiers |
|---|---|---|---|---|---|
| Binance | 0.10% | 0.10% | 0.02% | 0.04% | 10 |
| Coinbase Advanced | 0.40% | 0.60% | 0.00% | 0.05% | 8 |
| Kraken | 0.16% | 0.26% | 0.00% | 0.10% | 7 |
| OKX | 0.08% | 0.10% | -0.005% | 0.02% | 8 |
| Bybit | 0.10% | 0.10% | 0.00% | 0.02% | 6 |
| KuCoin | 0.10% | 0.10% | -0.005% | 0.025% | 13 |
Several patterns stand out. Binance uses a flat 0.10%/0.10% base that only differentiates maker-taker at higher tiers. Coinbase charges a significant premium at the base level, banking on its brand and regulatory trust. Kraken and OKX offer maker rebates at top tiers, effectively paying their largest traders to provide liquidity. KuCoin has the most granular tier structure with 13 levels.
For a new exchange, pricing at or slightly below Binance’s base rates (0.08-0.10% maker, 0.10-0.12% taker) is a reasonable starting point. Pricing above Coinbase is suicidal unless you offer something truly unique.
Maker-Taker Spread Economics
The spread between your maker and taker fee is one of the most consequential decisions in your fee structure. It determines the economics of market making on your platform, which directly impacts liquidity depth and spread tightness.
Why Makers Get Discounts
A market maker placing a limit order at $50,000 for BTC is taking risk. The price might move away from their order, leaving it unfilled. Or it might move against them, filling the order at a loss. The maker fee discount compensates for this risk and incentivizes constant liquidity provision.
Without maker discounts, professional market makers will not operate on your exchange. Without market makers, your order books will be thin, spreads will be wide, and retail traders will get poor execution. Poor execution drives traders away. It is a death spiral.
Optimal Spread Width
The maker-taker spread needs to be wide enough to incentivize liquidity provision but narrow enough that taker fees remain competitive:
- 2-5 basis points spread: Minimally differentiates maker and taker. Common on high-volume exchanges where the sheer volume compensates for thin margins.
- 5-10 basis points spread: The sweet spot for most exchanges. Meaningful enough to attract market makers, not so wide that takers feel gouged.
- 10-20 basis points spread: Aggressive liquidity incentivization. Works when you are bootstrapping a new exchange and desperately need order book depth.
- Negative maker fees (rebates): The ultimate liquidity magnet. You pay makers -0.01% to -0.02% per trade. Expensive, but it can transform a thin order book into a deep one within weeks.
Market Maker Agreements
Beyond your public fee schedule, most exchanges negotiate private agreements with professional market makers. These typically include:
- Sub-zero maker fees (rebates of -0.01% to -0.03%)
- Minimum quoting obligations (must maintain orders within X% of mid-price)
- Minimum order size requirements
- Volume commitments
- Penalties for excessive quote-to-trade ratios
These agreements are essential for bootstrapping liquidity on new trading pairs. Your matching engine must support configurable fee rates per account to enable this.
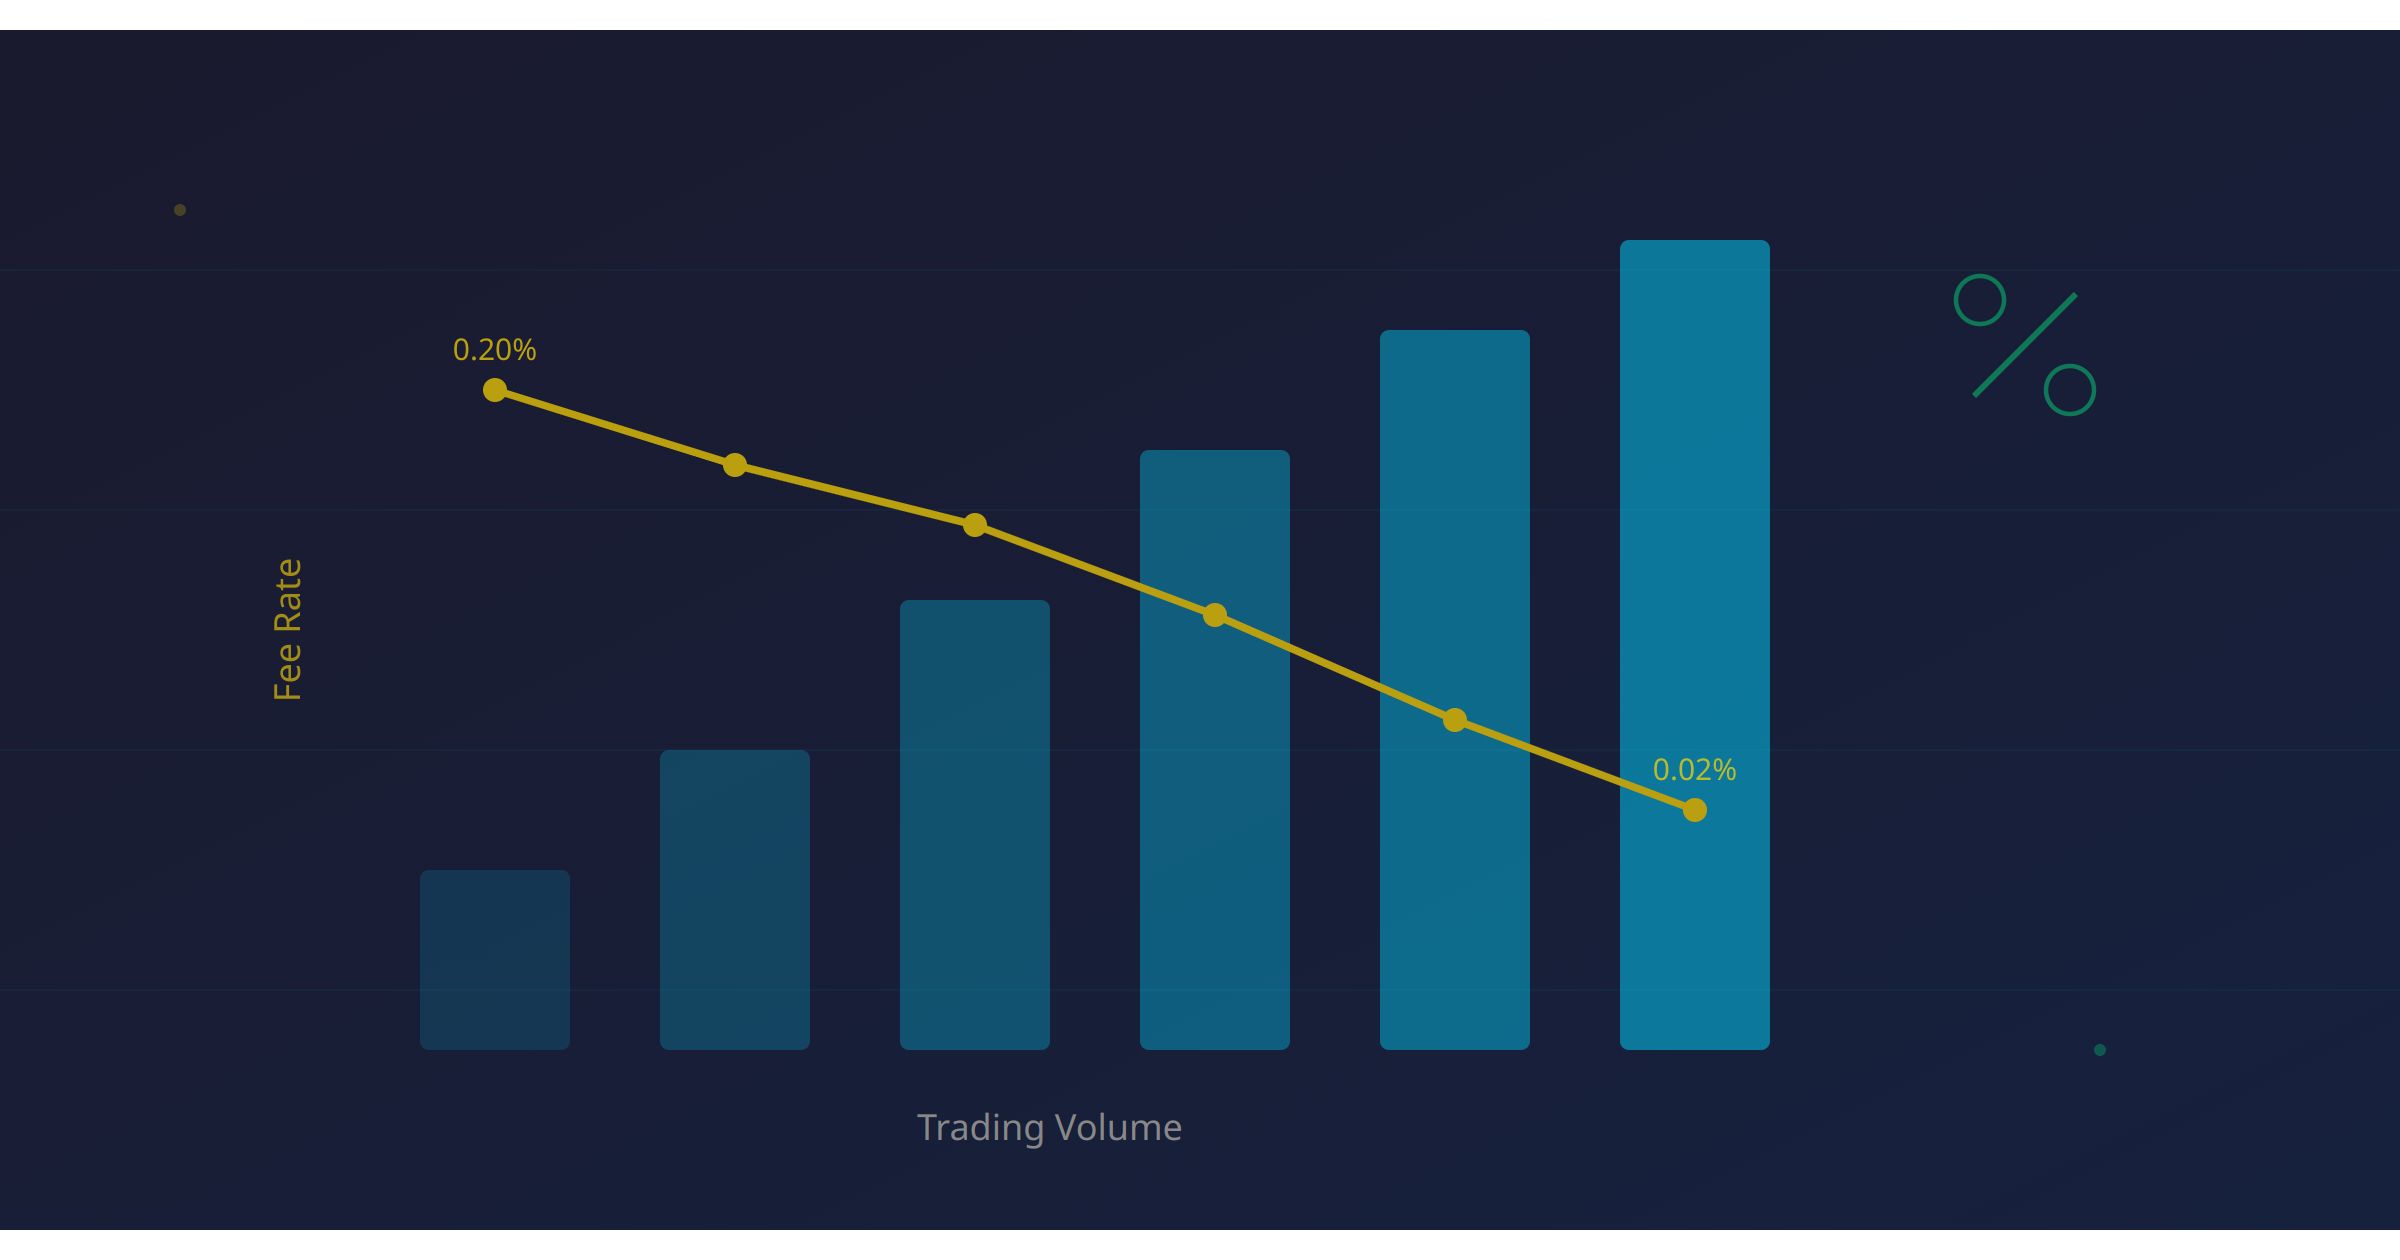
Volume-Based Tier Design
Tier design is part science, part psychology. The goal is to create a progression system that rewards loyalty, incentivizes volume concentration on your platform, and makes it psychologically painful to switch exchanges.
How Many Tiers?
The data from major exchanges suggests 6 to 10 tiers is optimal:
- Fewer than 5 tiers: Not enough granularity. The jump between tiers is too large, so traders in the middle of a tier have no near-term incentive to increase volume.
- 6-10 tiers: Enough steps that most active traders can see the next tier as achievable. Creates constant micro-motivation to trade more.
- More than 12 tiers: Becomes confusing. Traders cannot remember where they are or what comes next. The psychological benefit of progression diminishes.
Designing Breakpoints
Your tier breakpoints should follow a logarithmic or exponential curve, not a linear one. Here is a well-designed 8-tier structure:
| Tier | 30-Day Volume (USD) | Maker Fee | Taker Fee |
|---|---|---|---|
| Standard | < $50,000 | 0.10% | 0.20% |
| Bronze | $50,000 - $250,000 | 0.09% | 0.18% |
| Silver | $250,000 - $1,000,000 | 0.07% | 0.15% |
| Gold | $1M - $5M | 0.05% | 0.12% |
| Platinum | $5M - $25M | 0.03% | 0.10% |
| Diamond | $25M - $100M | 0.02% | 0.08% |
| VIP 1 | $100M - $500M | 0.01% | 0.05% |
| VIP 2 | $500M+ | 0.00% | 0.03% |
Notice that the first few tiers have small gaps ($50K to $250K) while the upper tiers have massive gaps ($100M to $500M). This ensures that most traders are distributed across the lower tiers where fees are highest, while the top tiers are reserved for institutional players who would negotiate custom rates regardless.
Rolling Window Calculation
Most exchanges calculate volume on a trailing 30-day rolling window rather than a calendar month. This prevents the “end of month cliff” where traders suddenly lose their tier status on the 1st of each month. A rolling window smooths transitions and reduces support complaints.
Your backend system needs to maintain real-time volume aggregations per user. This is not trivial at scale — for implementation approaches and the infrastructure needed, see our guide on building exchange infrastructure.
Withdrawal Fee Strategies
Withdrawal fees are a secondary but meaningful revenue stream. There are three models:
Flat Withdrawal Fees
Charge a fixed amount per withdrawal regardless of the withdrawal size. This is the most common approach. You set the fee above the average network transaction cost and pocket the difference.
| Asset | Typical Withdrawal Fee | Approx. Network Cost | Margin |
|---|---|---|---|
| BTC | 0.0003 BTC | 0.0001 BTC | ~$15 at $75K BTC |
| ETH | 0.003 ETH | 0.001 ETH | ~$5 at $2,500 ETH |
| USDT (TRC-20) | 1 USDT | 0.5 USDT | $0.50 |
| USDT (ERC-20) | 5-15 USDT | 2-8 USDT | Variable |
Flat fees are regressive — they represent a larger percentage of small withdrawals. A 0.0003 BTC withdrawal fee is 3% on a $750 withdrawal but 0.03% on a $75,000 withdrawal.
Dynamic Withdrawal Fees
Adjust withdrawal fees based on real-time network congestion. When Ethereum gas prices spike, your ETH and ERC-20 withdrawal fees increase automatically. When the network is quiet, fees drop. This is more fair to users and prevents your exchange from absorbing unpredictable network costs.
Implementing dynamic fees requires a gas price oracle and automatic fee adjustment logic. The operational complexity is higher, but users appreciate the transparency.
Tiered or Free Withdrawals
Offer reduced or free withdrawals as part of your VIP tier program. This is a powerful retention tool — a high-volume trader who gets three free BTC withdrawals per month has a tangible reason not to switch to a competitor.
For a deeper look at how withdrawal fees fit into overall exchange economics, see our break-even analysis.
Deposit Fees and Fiat On-Ramp Margins
Crypto deposits are almost universally free. Charging for them would be anti-competitive and confusing to users, since the sender already pays the network fee.
Fiat deposits are a different story. The conversion from fiat to crypto involves payment processing costs, banking partner fees, and compliance overhead. Most exchanges embed these costs in the spread rather than charging an explicit fee:
- Bank transfer deposits: Usually free (your banking partner charges you 0.1-0.5%, but you absorb it)
- Credit/debit card deposits: 1.5% to 3.5% fee (payment processors charge 2-3%, so your margin is thin)
- Third-party on-ramp partners: These providers (MoonPay, Simplex, Banxa) charge 3-5% and share 30-50% of the fee with you
The strategic decision is whether to subsidize fiat deposits to reduce friction or to monetize them as a revenue stream. Most exchanges subsidize bank transfers (free) to reduce onboarding friction but charge for card deposits where the convenience premium justifies it.
Listing Fees as a Revenue Stream
Token listing fees range from zero (for established, high-demand tokens) to $500,000+ (for new projects seeking exposure). This is one of the most variable revenue streams in the exchange business.
A structured approach to listing fees might include:
- Standard listing: $10,000 - $50,000. Includes basic pair setup, order book initialization, and a social media announcement.
- Premium listing: $50,000 - $200,000. Adds marketing support, homepage banner placement, trading competitions, and airdrop campaigns.
- Launchpad listing: Revenue share on token sale proceeds, typically 5-10% of funds raised.
The ethical considerations are significant. Listing low-quality tokens purely for fee revenue damages user trust and invites regulatory scrutiny. A rigorous listing review process protects your users and your reputation, even if it means turning away listing fee revenue.
For a deeper exploration of listing economics and other revenue models, we have covered those extensively.
Token-Based Fee Discounts: The BNB Model
Binance pioneered the exchange utility token model with BNB, and it remains one of the most effective fee structure innovations in the industry. The mechanics are straightforward: users who hold and pay fees in the exchange’s native token receive a discount, typically 10-25%.
How It Works
- Exchange issues a native token (e.g., BNB, KCS, OKB, HT)
- Users can opt to pay trading fees in the native token instead of the traded asset
- Token-payers receive a fee discount (Binance originally offered 50%, now reduced to 25%)
- The exchange periodically buys back and burns tokens using revenue, creating deflationary pressure
Why It Works
The token discount model creates multiple reinforcing effects:
- Reduced effective fees attract price-sensitive traders
- Token holding requirement increases switching costs (selling your token stack to leave means realizing a potential loss)
- Buy pressure from users purchasing tokens for fee payment supports token price
- Burns reduce supply over time, creating a wealth effect for holders
- Ecosystem lock-in — once a trader holds your token, they are psychologically invested in your platform’s success
Design Considerations
If you are building an exchange token, the tokenomics design must balance discount depth, token supply, burn schedule, and regulatory constraints. Key decisions include:
- Discount percentage: 10-25% is the current norm. Deeper discounts accelerate adoption but reduce revenue.
- Discount decay: Binance reduced its BNB discount from 50% to 25% over time as adoption matured. Building in a decay schedule from day one sets expectations.
- Regulatory classification: Your token must not be classified as a security. Fee utility is one of the strongest arguments for utility token classification, but legal counsel is essential.
Futures and Margin Fee Considerations
Derivatives trading introduces fee structures that do not exist in spot markets. If your exchange offers futures trading, you need to account for several additional fee types.
Trading Fees on Perpetual Contracts
Perpetual futures typically have lower trading fees than spot because the volume is significantly higher and competition is fierce. Common rates:
- Maker: 0.02% - 0.05%
- Taker: 0.04% - 0.07%
Funding Rates
Perpetual futures use funding rates to keep the contract price anchored to the spot price. Long positions pay short positions (or vice versa) every 8 hours. The exchange does not directly profit from funding rates — they are peer-to-peer transfers — but they generate trading activity as arbitrageurs exploit funding rate differentials.
Some exchanges add a small insurance fund contribution (0.01-0.015%) on top of the funding rate, which serves as indirect revenue.
Liquidation Fees
When a leveraged position is liquidated, the exchange typically charges a liquidation fee of 0.5% to 1.5% of the position value. This fee covers the cost of force-closing the position in a potentially volatile market and contributes to the insurance fund.
Liquidation fees are pure revenue for the exchange, and on volatile days, they can exceed regular trading fee revenue by a significant margin. However, designing liquidation mechanics to maximize fee extraction at the expense of user protection is both unethical and a regulatory red flag.
Margin Interest
For margin trading (as opposed to futures), the exchange lends assets to traders and charges interest. Typical rates range from 0.01% to 0.05% per day, depending on the asset and utilization rate. This is a straightforward lending business embedded within your exchange.
The Psychology of Exchange Fees
Fee perception matters as much as fee reality. Two exchanges can charge effectively identical rates but have wildly different user perceptions based on how they present their fees.
Transparent vs. Hidden Fees
Some exchanges advertise “zero fees” but embed costs in wider spreads. Others charge explicit fees but offer tight spreads. Research consistently shows that sophisticated traders prefer transparent explicit fees, while retail users are more sensitive to advertised headline rates.
The worst approach is hidden fees combined with high advertised fees. If users feel deceived after discovering spread markups or hidden charges, the trust damage is permanent.
Anchoring and Reference Points
When a user sees “0.10% fee,” they evaluate it relative to their reference points. If they are coming from Coinbase (0.40-0.60%), your 0.10% feels like a bargain. If they are coming from a zero-fee promotion, your 0.10% feels expensive.
This is why competitive positioning matters. Your marketing should explicitly frame your fees against higher-fee competitors, not against zero-fee promotions.
Round Numbers and Simplicity
Fees of 0.10%, 0.20%, and 0.50% feel cleaner and more trustworthy than fees of 0.13%, 0.17%, or 0.42%. Users subconsciously associate round numbers with straightforward dealing. Save the odd numbers for your upper-tier volume discounts where precision signals sophistication rather than complexity.
The “Free Withdrawal” Effect
Offering free withdrawals — even limited to one or two per month — has a disproportionate psychological impact on user retention. The actual cost to your exchange might be $5-10 per user per month, but the perceived value to the user is much higher because withdrawal fees are a visible friction point at the moment they are most emotionally engaged (when moving funds).
Implementation Considerations
Designing a fee structure on paper is one thing. Implementing it in a production trading system is another. Several technical challenges deserve attention.
Real-Time Tier Calculation
Your trading engine must look up a user’s current fee tier on every order placement. This lookup must be fast — sub-millisecond — to avoid adding latency to order processing. Common approaches include:
- Pre-computing tier assignments in a background job and caching the result
- Storing the user’s tier in-memory within the matching engine
- Recalculating tiers hourly or daily rather than on every trade
The choice depends on your matching engine architecture and latency requirements.
Fee Collection Mechanics
Fees can be collected in three ways:
- Quote currency deduction: On a BTC/USDT buy, deduct the fee from USDT before crediting BTC. Simple but reduces the user’s fill.
- Base currency deduction: On a BTC/USDT buy, credit full BTC but deduct fee in BTC. The user receives slightly less BTC than expected.
- Native token deduction: If the user has opted in, deduct the fee equivalent in your exchange token. Requires real-time token pricing.
Each approach has accounting implications. Base currency deduction is the most common because it keeps the order matching logic clean — the fill price is the fill price, and the fee is handled post-match.
VIP and Custom Rate Programs
Your system must support per-account fee overrides for VIP traders and market makers with negotiated rates. This means your fee lookup logic cannot simply be “check the tier table.” It must also check for account-specific overrides and apply the lower of the two.
A typical implementation hierarchy:
- Check for account-specific custom rate
- If none, check the user’s volume tier
- Apply token-based discount if eligible
- Apply any active promotions or campaign discounts
- Return the final effective fee rate
Fee Audit Trail
Every fee charged must be logged with the order ID, user ID, fee rate, fee amount, fee currency, and the reason the rate was applied (tier, custom agreement, promotion). This audit trail is essential for regulatory compliance, dispute resolution, and revenue analytics.
Competitive Pricing Strategy for New Exchanges
If you are launching a new exchange, you face a cold-start problem: no volume means no traders, and no traders means no volume. Your fee structure is one of the levers you can pull to break this cycle.
Phase 1: Acquisition (Months 1-6)
- Set base fees 20-30% below the largest competitor in your target market
- Offer a “launch promotion” with zero maker fees for the first 3-6 months
- Provide free withdrawals for early adopters (first 1,000 users)
- Negotiate aggressive market maker agreements with negative maker rebates
Phase 2: Growth (Months 6-18)
- Gradually introduce maker fees, starting at 0.02-0.03%
- Launch your volume tier program
- Introduce your exchange token with fee discounts
- Begin charging standard withdrawal fees with VIP exemptions
Phase 3: Optimization (Month 18+)
- A/B test fee adjustments on low-volume pairs
- Introduce premium features (faster withdrawals, advanced API access) with fee implications
- Optimize your tier breakpoints based on actual volume distribution data
- Negotiate listing fees from a position of strength
The key principle: it is much easier to lower fees than to raise them. Start competitive, prove your value, and only increase fees when you have built enough switching cost and brand equity to retain traders through a price increase. For a complete timeline of exchange milestones including fee strategy, see our break-even analysis.
Fee Revenue Modeling With Real Numbers
Let us model fee revenue for a hypothetical exchange at three volume levels to illustrate how fee structure decisions compound into revenue.
Scenario: Mid-Sized Regional Exchange
Assumptions:
- 60% of volume is taker, 40% is maker
- Average tier: Silver (0.07% maker / 0.15% taker) for most volume
- 15% of users pay in native token (25% discount)
- 3,000 withdrawals per day at average $8 margin per withdrawal
At $10M daily volume:
| Revenue Source | Daily | Monthly |
|---|---|---|
| Taker fees (60% x $10M x 0.15%) | $9,000 | $270,000 |
| Maker fees (40% x $10M x 0.07%) | $2,800 | $84,000 |
| Token discount reduction (-15% x combined x 25%) | -$442 | -$13,275 |
| Withdrawal fees (3,000 x $8) | $24,000 | $720,000 |
| Total | $35,358 | $1,060,725 |
At $50M daily volume:
At 5x the volume, your average fee rate drops because more traders hit higher tiers, but total revenue grows significantly:
| Revenue Source | Daily | Monthly |
|---|---|---|
| Trading fees (blended ~0.09%) | $45,000 | $1,350,000 |
| Token discount reduction | -$1,688 | -$50,625 |
| Withdrawal fees (8,000 x $8) | $64,000 | $1,920,000 |
| Listing fees (2 per month) | - | $60,000 |
| Total | $107,312 | $3,279,375 |
At $200M daily volume:
| Revenue Source | Daily | Monthly |
|---|---|---|
| Trading fees (blended ~0.065%) | $130,000 | $3,900,000 |
| Token discount reduction | -$4,875 | -$146,250 |
| Withdrawal fees (20,000 x $8) | $160,000 | $4,800,000 |
| Listing fees (5 per month) | - | $250,000 |
| Margin/futures fees | $40,000 | $1,200,000 |
| Total | $325,125 | $10,003,750 |
Notice how withdrawal fees represent a larger share of revenue than many operators expect. At $10M daily volume, withdrawal fees actually exceed trading fees. This is typical for smaller exchanges and illustrates why withdrawal fee strategy matters.
These projections align with the revenue modeling frameworks we have covered previously, applied specifically to fee structure design.
Putting It All Together
Designing a crypto exchange fee structure is a multi-dimensional optimization problem. You are balancing revenue maximization against trader acquisition, liquidity depth, competitive positioning, and operational complexity — all simultaneously.
The exchanges that get fees right share several characteristics:
- They start with competitive base rates and earn the right to charge more through superior execution and features.
- They invest in maker incentives because liquidity quality drives everything else.
- They design volume tiers that create progression psychology, making traders feel invested in climbing the ladder.
- They use token-based discounts to build ecosystem lock-in and create a secondary value proposition for their platform.
- They treat withdrawal fees as a retention lever, not just a revenue line, offering free withdrawals to their most valuable users.
- They maintain transparency, because trust compounds more reliably than hidden fee margins.
Your fee structure will evolve as your exchange grows. What works at $5M daily volume will not work at $100M. Build flexibility into your systems from day one — configurable rates, per-account overrides, real-time tier calculation, and complete fee auditing.
If you are ready to build an exchange with the infrastructure to support sophisticated fee structures, Codono’s crypto exchange software includes configurable maker-taker fees, volume-based tiers, VIP rate management, and token-based discount systems out of the box. The fee structure is yours to design — the platform handles the implementation.
Codono Team
Codono builds enterprise-grade crypto exchange software deployed by 250+ operators across 40+ countries. Our team writes from production experience running spot, derivatives, custody, and compliance at scale.
View all posts by Codono Team →